Blog

IELTS writing TASK 1 Grammar

IELTS TOEFl

When you write a report on a graph or chart for IELTS TASK 1, make sure the tense is consistent. You can write the whole essay in past or present tense. 

You should spend about 20 minutes on this task.

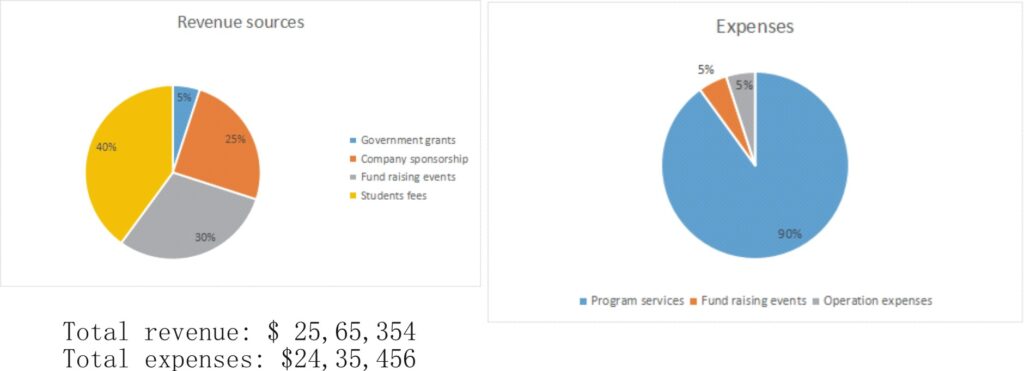
The pie chart shows the amount of money that a school  located in the country X spent and received in one year, 2024.

Summarize the information by selecting and reporting the main features and make comparisons where relevant.

Write at least 150 words.


IELTS

Look at the graph and read the student’s report. Then complete the report with the correct form of the verbs  from this list

see, show,account,exceed,provide,is,


You can use the same word again

The pie charts (1)  the amount of revenue and expenditures in 2024 for a school in the Country X. Overall, it can be (2)   that Student fees accounted for the majority of the income, while program services (3)  for the most expenditure. Total revenue sources just (4)  outgoings.

In detail, Student fees (5)  most of the revenue for the school, at 40%. Similarly, with regard to expenditures, one category, program services, (6)  for nearly all of the outgoings, at 90%. 

The other categories (7)  much smaller. Fund raising events, which were the second largest revenue source, brought in 30% of overall income, and this (8)  followed by Company sponsorship, at 25 %.  government grants were very small source of revenue, accounting for only 5%.

There were only two other expenditure items, fundraising and operational expenses, accounting for 10% together. The total amount of income was $ 25,65,354, which was just enough to cover the expenditure of $24,35,456. 


Leave a Reply

Your email address will not be published. Required fields are marked *

Call Now Button